Report Author
If your installation has purchased a Report Author license and granted you the appropriate security rights, you can access the Report Author tools to create your own reports and dashboards.
If you cannot access the Report Author tool, contact your Accruent Account Representative for more information.
 Open the Report Author Tools
Reports have two basic components: the format and the data. You can approach creating a report from either direction. That is, you can select the type of report you want to create first and then select your data source. Or, you can select your data source first and then select the type of report you want to create.
Open from the New Menu
Clicking the New button in the side navigation allows you to create a report by selecting the format first, then the data source.
-
Click the New button at the bottom of the side navigation bar.
The New menu opens.
-
Select Report.
The Templates and themes page opens.
-
Select the Blank template and click OK.
The New report page opens.
-
In the Insertable objects pane on the left side of the page, click Select sources.
The Open file dialog box opens, allowing you to select a data source.
-
Select the Team content > Famis - 360Facility > [Your org name] > Model> Famis360 data model and click Open.
The Famis360 data model populates the Insertable objects pane, allowing you to select the data to add to the report format you have selected.
Open from the Team Content Menu
Clicking the Team content menu in the side navigation allows you to create a report by selecting the data first, then the report format.
-
Click the Team content menu in the side navigation bar.
The Team content menu opens.
-
Click to the Famis - 360Facility > [Your org name] > Model> Famis360 folder and click the More
 button.
The More menu appears.
-
Select Create report.
The Templates and themes page opens.
-
Select the Blank template and click OK.
The New report page opens with the Famis360 data model populated.
Report Author Tools Navigation
Once you have opened the Report Author and are creating or editing a report, the following navigation tools are available along the top of the page:

|
Save – Click to save the report to the selected folder |

|
Edit – Click to switch into and out of edit mode which allows changes to be made to the report (black indicates edit mode is enabled) |

|
Undo – Click to step back through and undo the most recent changes to the report (enabled once changes are made) |

|
Redo – Click to step forward and redo the most recent changes to the report (enabled once Undo has been used) |

|
Run – Click to run the report in a selected format and set run options such as paper size or language |

|
Share – Click to share a report by email or link |
The following Report Author navigation tools are available on the Insertable objects pane:

|
Data – Click to select the data source |

|
Toolbox – Click to choose the type of content to generate (for example text item, list, or hyperlink) |

|
Find – Enter a search in this field to find a particular query field within the data model |
To the right of the Insertable objects pane is the Canvas where you build your report.
Clicking the plus  button in the middle of the page opens a menu of items you can create. Or, you can drag objects and data from the left side pane onto the Canvas to create your report.
The following Report Author tools are available above the top right of the Canvas:

|
Lock Page Object – Click to lock/unlock selected objects on the Canvas for editing |
|
Page View – Click to open a menu and select either the Page design, Page preview, and Page structure modes |

|
More – Click to open a menu with a wide array of options for editing the report |

|
Properties – Click to modify a detailed list of properties for the selected object on the Canvas |
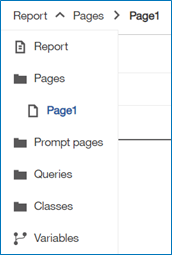
The following Report Author views are available by clicking Report above the Insertable objects pane:
-
Pages – Click to review the pages of your report
-
Prompt pages – Click to view the prompt pages used in the report
-
Queries – Click to view the queries the report is running
-
Classes – Click to view the classes and styles used in the report
-
Variables – Click to view the variables the report is running, which could include language, string, and Boolean variables
About Data Sources
When you select a data model, it loads into the Data view of the Insertable objects pane. You can expand the items you see to navigate through the data model to find the exact data items you need. You can also use the Find field to search for a specific query item in the data model.
-
Name Spaces are at the top level and represent the represent different areas of the Famis/360Facility application, for example, Assets or Crew.
- Query Subjects are within these name spaces and are used to classify and organize and the data items, for example, Crew or Crew Leader beneath the Crew name space.
-
Query Items are the bottom level and represent the individual pieces of data that you will use in your reports. There are four types of query items:
-
Identifiers
 – unique selectors that identify an item in the database, for example, Key Template Id
 -
Measures
 – numerical values that are auto-aggregated at the bottom of a report, for example, Key Template Copies Available
 -
Attributes
 – string values that add context to the data, for example, Key Template Hook Number
 -
Date/Time
 – values that identify date or time, for example, Return Date
-
Create a Report
Report formats and options allow you to view data in the most effective way possible. The basic process for creation a report is as follows:
-
From the New menu, select Report.
-
On the Templates and themes page, select Blank and then click OK.
-
In the Insertable objects pane, select your data source from the Famis - 360Facility > [Your org name] > Model> Famis360 data model.
-
In the report editor Canvas, click the plus
button.The following report format options appear:
-
List – Contains a set of columns with values in the rows
-
Crosstab – Contains query items on both the rows and columns of the report and the cells display an aggregation of a measure for both items; for example, you could create a crosstab report that displays the total number of work requests per crew at each property
-
Visualization – A graphical report with data usually represented by proportional size; for example, a pie chart
-
-
Select a report format.
A dialog box opens, allowing you to name the object.
-
Enter a Name and click OK.
The object appears on the Canvas.
-
Drag and drop query items from the Insertable objects pane to the object on the Canvas.
The type of query item added may depend on the format of the object/report. For example, on a crosstab report you might drag an identifier or attribute query item into the column and row headers (such as Property Name and Crew Description), and then drag a measurement identifier (such as Request Count) into the body of the table. This would show you the number of requests assigned to a crew at specific properties.
-
To preview your report, click Page design and select Page preview from the menu.
A preview of your report appears, containing data.
-
To save your report, click the Save
 button, select a location for your report, and click Save.
Open the Dashboard Author Tools
Dashboards are summaries of data that are visually interactive, allowing users to access different dimensions of the data. They tend to be more high-level, executive summaries that have an infographic look in their design and layout. Like creating a report, you can either create the dashboard format first, and then select the data source, or vice versa.
Open from the New Menu
Clicking the New button in the side navigation allows you to create a dashboard by selecting the format first, then the data source.
-
Click the New button at the bottom of the side navigation bar.
The New menu opens.
-
Select Dashboard.
The Select a template page opens.
-
Select a template and click OK.
The New dashboard page opens.
-
In the Selected sources pane on the left side of the page, click Select sources.
The Add a data source dialog box opens, allowing you to select a data source.
-
Select the Famis - 360Facility > [Your org name] > Model> Famis360 data model and click Add.
The Famis360 data model populates the Sources pane, allowing you to select the data to add to the dashboard format you have selected.
Open from the Team Content Menu
Clicking the Team content menu in the side navigation allows you to create a dashboard by selecting the data first, then the format.
-
Click the Team content menu in the side navigation bar.
The Team content menu opens.
-
Click through the folders to Famis - 360Facility > [Your org name] > Model> Famis360 and click the More
button.The More menu appears.
-
Select Create dashboard.
The Select a template page opens.
-
Select a template and click OK.
The New dashboard page opens with the Famis360 data model populated.
Dashboard Author Tools Navigation
Once you have opened the Dashboard Author and are creating or editing a dashboard, the following navigation tools are available along the top of the page:
|
|
Save – Click to save the dashboard to the selected folder |
|
|
Edit – Click to switch into and out of edit mode which allows changes to be made to the dashboard (black indicates edit mode is enabled) |
|
|
Undo – Click to step back through and undo the most recent changes to the dashboard (enabled once changes are made) |
|
|
Redo – Click to step forward and redo the most recent changes to the dashboard (enabled once Undo has been used) |

|
Full Screen – Click to display the dashboard in full screen size |

|
Links – Click to display the links between objects for filtering and selecting |

|
Properties – Click to modify a detailed list of properties for the selected object on the Canvas |
|
|
Share – Click to share a dashboard by email or link or to export to PDF |
The following Dashboard Author navigation tools are available along the side of the page:

|
Data – Click to view or select the data source |

|
Pins – Click to pin a visualization for reuse or select a pinned visualization |

|
Search – Click to search your data to find data properties you want to use in the dashboard |

|
Visualizations – Click to select a chart, table, or map to use in the dashboard |

|
Widgets – Click to select a widget, such as a text object, image, or shape to add to your dashboard |
Create a Dashboard
Dashboards can contain several types of widgets that you use to create visualizations of data that users can interact with.
To create a dashboard:
-
From the New menu, select Dashboard.
-
On the Select a template page, select Freeform and then click OK.
-
Click the plus
 button to select your data source.
 -
Select the Famis - 360Facility > [Your org name] > Model> Famis360 data model.
-
In the Sources pane, expand items to locate the query items you want to add to the dashboard and the drag them out onto the Canvas.
A visualization is automatically created.
-
Click the Expand
 button in the top right corner of the chart to specify chart parameters.
In the pane that appears, you can modify query items, designate colors for a query item, and more.
-
Click the Move widget
 button to move the column chart into the appropriate position on the dashboard.
 -
Drag the corners of the widget to re-size it.
-
To preview your dashboard, click the Edit
 button to take the dashboard out of edit mode and into preview mode.
 -
Repeat these steps with different visualizations and/or query items to create a dashboard with multiple widgets.
-
To save your dashboard, click the Save
button, select a location for your dashboard, and click Save.